Transform your Distributor Sales Data into Easy-to-Read Dashboard

We help businesses to visualize, analyze, and evaluate Sales and Inventory Data.

Be Data-Driven

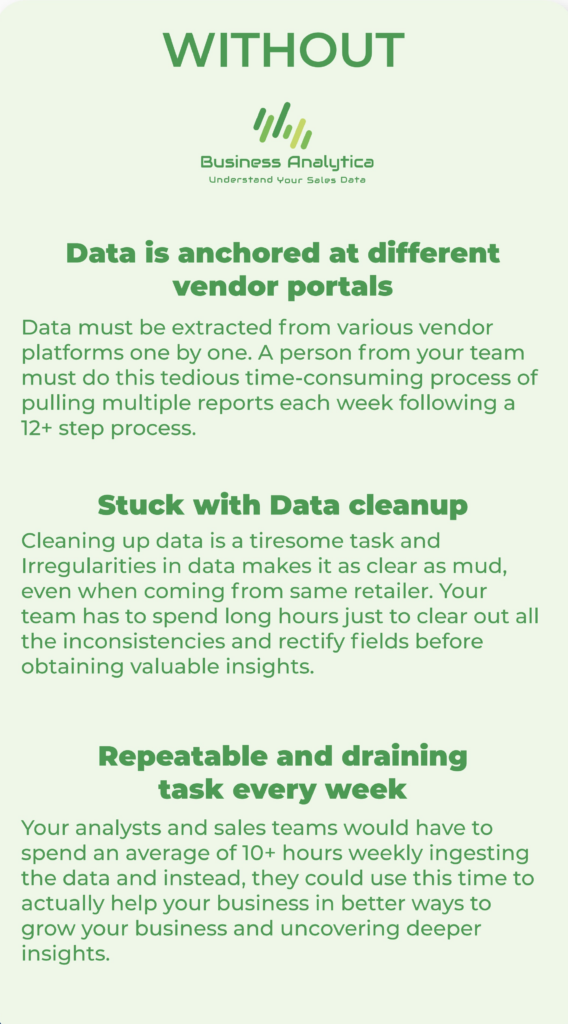
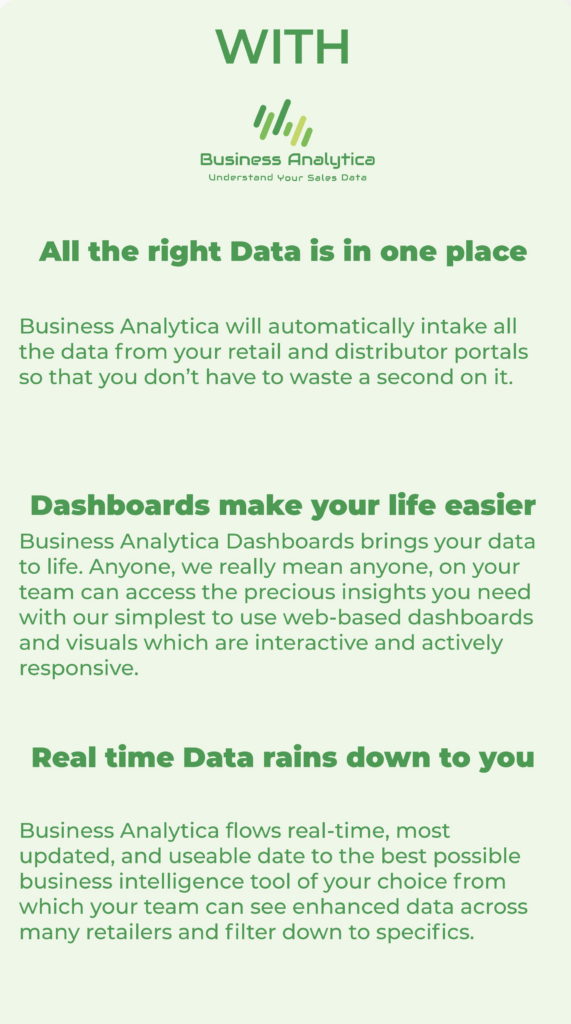
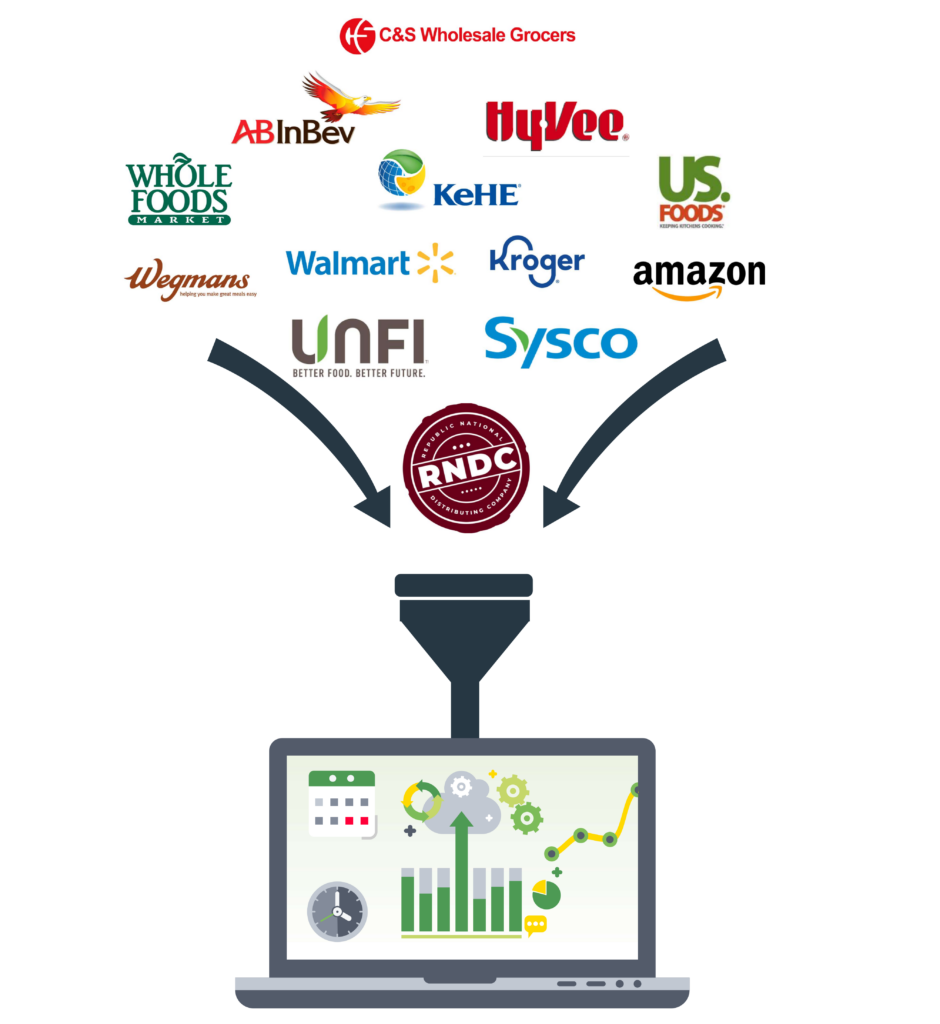
Business Analytica is a monthly service which take sales and inventory data that brands receive from their distributors  and convert them into easy-to-understand graphs and charts so you can make quick, well-informed decisions and better manage your business smoothly at scale.
Use our dashboards to identify actionable insights.

Business Analytica’s interactive dashboards make your supplier data easy to understand, and you can get revealing valuable insights through clickable charts and visualizations.

advanced divider

Overview Tab

Track the overall health of your brand both in terms of Units Shipped and Dollar Sales while having visibility at the product, distributor, retailer, state, city, and store level.

Product Tab

This tab allows you to track the performance of an individual product over time to see the trends and identify cyclical and seasonal patterns.

Store Tab

Track the order history of a specific store over time to decide on discounts and other promotional activities.

No Buy Tab

Easily spot active, at-risk, inactive and Lost customers based on recent changes in order history while filtering these stores by product, distributor, retailer, city, state and distribution centers

Velocity Tab

Track velocity (Unit shipped per store per week) over time to easily see where velocity is strong and where it can improve while comparing velocity over different distributors, retailers, and channels.

Retention Tab

Closely monitor your customers and significantly improve retention rate. You can drill down to track number of repeat stores by product name, product size, distributors, retailers, chain, and Channel, city, state, distribution centers.

Let's Empower Your Data

advanced divider

Enhancing Quality of Your Data

We would do the hard work to ensure that you get the data in a format that you can understand and be ready to get the helpful precious insights to grow your business.

advanced divider

Parsing:
This means combining the same product which might be scattered and named differently across different distributors and retailers. This enables business to see the performance of each product across all distributors, retailers, and any third party source.

Geocode:
We will combines the same store whose address might be saved with different formats across different portals. This enables businesses to get the next tier of insight- – Dollar Sale and units shipped by state and city and Top store by state and city.

Deduplication:
We deduplicates store name that have been saved in the different format across different portals so you can easily find specific store level insights.

DRIVE GROWTH INSIGHTS​

advanced divider

Data Driven Business Planning

Expanding distribution is one of the top priorities for a growing CPG brand. But it’s not about growing just anywhere: it’s about finding the markets where your brand has the most possibility and likelihood of success. You need data to locate those opportunities. Business Analytica gives you a clear picture of your existing distribution and sales trends across retail locations with the power of Artificial Intelligence (AI). So, you can quickly identify the next retailer, geographic area, or even store that is similar to where you’re seeing that strong product-market fit.

360 degree Performance Management

Business Analytica enables brands to measure business performance nationwide, region by region, or even in a specific state and city. With Business Analytica, brands can also measure the standalone performance of their products and filter it by product size, distributor, retailer, chain, banner, state, and city, so that they are not missing out on any minor detail. Brands can even drill down to see the bottom-performing products and their drivers to find areas in which they struggle, which may indicate a need for consolidation or strategic repositioning.

Maximize Point of Distributions

Business Analytica empowers businesses to significantly increase store retention along with the visibility of unhappy stores to investigate their bad experience. Business Analytica categorizes all of your Stores (points of distribution) into four classes: New stores, Risk stores, Lost stores, and Inactive stores. Brands usually devise customized strategies for each store class to get higher store retention, reducing the risk of losing shelf space for their products.

Comprehensive Inventory Management

“If you can’t measure, it you can’t manage it” is the principle that derives our inventory reporting. Business Analytica provides complete visibility to on-hand, on-order, and at spoilage risk inventory along with the filter of product name, product size, retailor, distribution center, state, and city. Having such deep level visibility helps brands keep their products on shelves all the time, leading to higher sales. Brands also use inventory reports to reduce wastage and plan production.

Report Pricing

Our subscription starts at $249/month per data source.
We provide a 10% discount on the addition of new data source reporting.

Fuel Strategic Decision Making and Growth with Business Analytica.

Scroll to Top